OpenTelemetry for NestJS Microservices: Traces, Metrics & Grafana Without Months of Setup
A practical OpenTelemetry guide for NestJS microservices — distributed traces, metrics, and Grafana dashboards. Learn what to instrument first and how Cyber Infoware kits ship observability ready for production.
- OpenTelemetry
- NestJS
- Grafana
- Observability
- Microservices
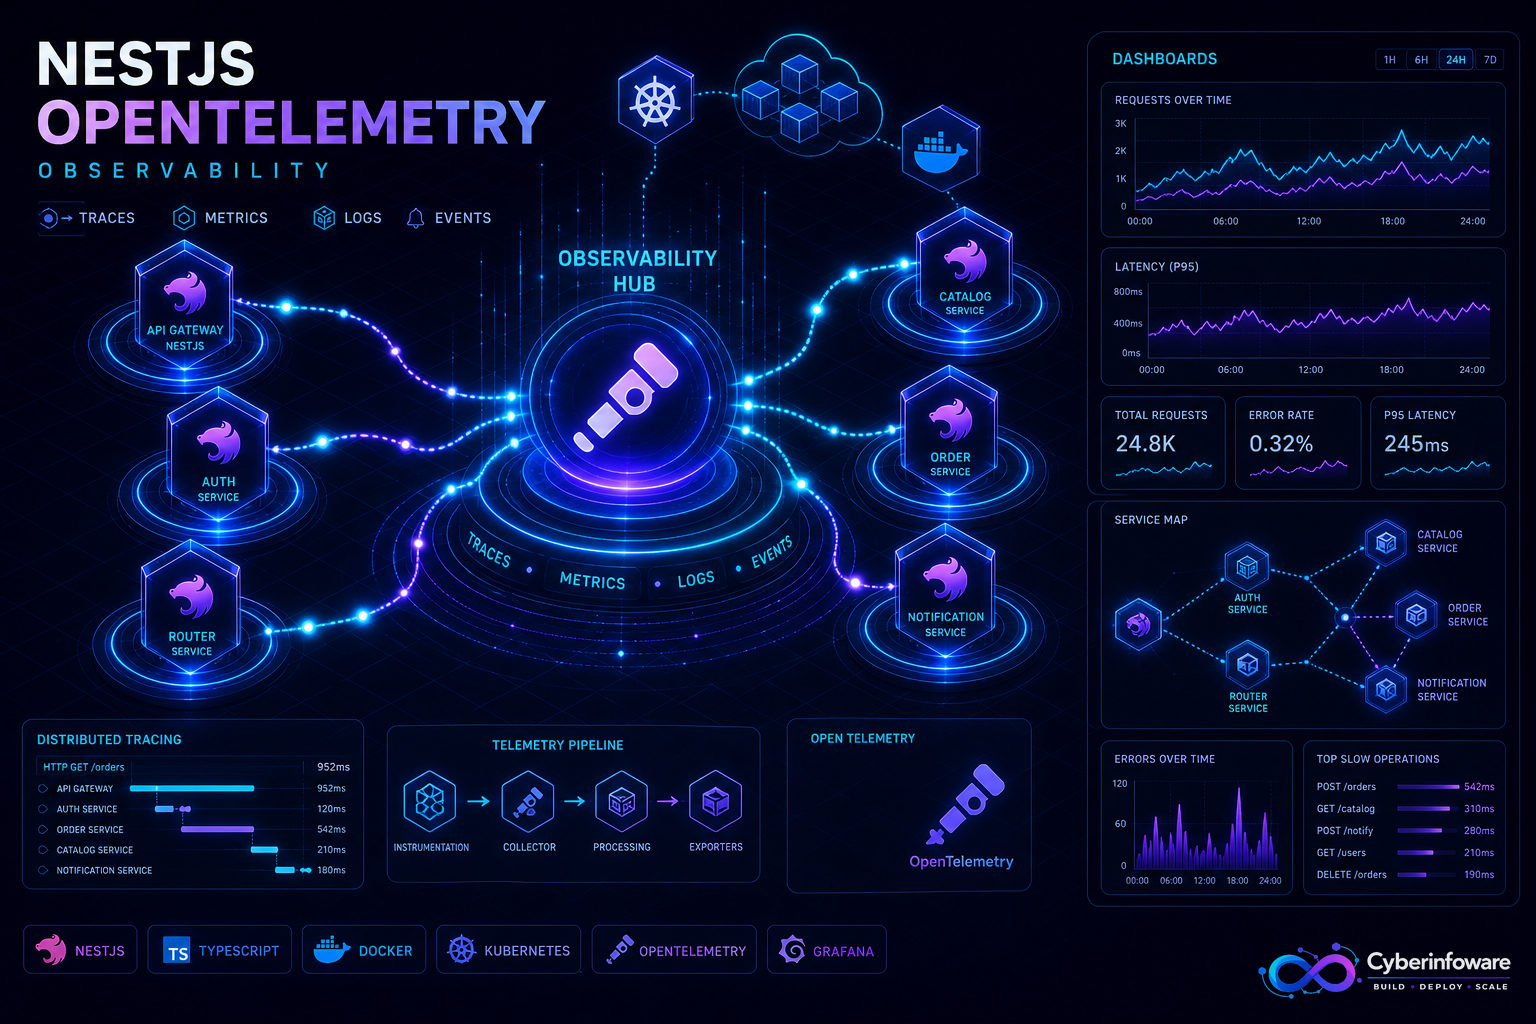
OpenTelemetry turns "the API feels slow" into a trace you can follow — gateway → order service → PostgreSQL → RabbitMQ consumer — with timings on every hop. For NestJS microservices and multi-tenant SaaS, that visibility is the difference between guessing and fixing production incidents in minutes.
This guide covers what to instrument first in NestJS, how traces and metrics land in Grafana, and how Cyber Infoware kits ship an observability path so you do not rebuild exporters, collectors, and dashboards from scratch.
Why microservices without tracing feel broken
- A single user request touches gateway, auth, two services, a cache, and a queue
- Logs alone cannot prove which hop added 800ms
- Kubernetes restarts hide symptoms until customers complain
- Without correlation IDs across services, on-call becomes archaeology
What to instrument first in NestJS
- HTTP / gateway edge — inbound latency, status codes, route names
- Outbound calls — service-to-service HTTP/gRPC and DB query spans
- Messaging — publish/consume spans for RabbitMQ (or similar) with message ids
- Auth boundary — Keycloak/JWT validation time as a first-class span attribute
- Business events — tenant id, plan, and feature flags as attributes (never raw secrets/PII)
Traces vs metrics vs logs
- Traces — answer "where did this request go?"
- Metrics — answer "is error rate rising across pods?"
- Logs — answer "what exactly failed inside this span?"
- OpenTelemetry unifies export; Grafana (or similar) is where teams read the story
A practical production checklist
- Propagate context across gateway and services (W3C traceparent)
- Sample thoughtfully in high-traffic routes; keep errors at higher sample rates
- Name spans after business operations (`OrderService.create`), not only framework internals
- Alert on golden signals: latency, traffic, errors, saturation — not vanity charts
- Verify a deploy by watching a known trace path smoke-test after rollout
If you cannot follow one checkout request across services in Grafana, you do not have microservices observability — you have hope.
SaaS-specific observability tips
- Tag spans with tenant id (hashed/opaque if needed) to isolate noisy neighbors
- Watch billing and entitlement paths separately — revenue bugs deserve dedicated dashboards
- Correlate deploy markers with error spikes after each kit-based release
- Pair Redis/RabbitMQ metrics with NestJS traces when diagnosing "async lag"
What "done" looks like
You merge a NestJS change, deploy, and within minutes confirm the new version in Grafana — with a clean trace from gateway to domain service and no mystery latency. That is the delivery bar modern SaaS buyers quietly assume. Explore packages on cyberinfoware.com/products or contact us to match a kit to your observability goals.
Explore Cyber Infoware packages
Production NestJS SaaS foundations with commercial licensing — pick the architecture that matches your team.
- NestJS Microservice Starter Kit
Production NestJS microservices — API gateway, Keycloak SSO, RabbitMQ, Docker, Kubernetes, and Terraform.
- Enterprise SaaS Microservices Boilerplate
Full multi-tenant SaaS control plane as NestJS microservices — service-per-DB, billing, audit, notifications.
- Multi-Tenant SaaS Boilerplate
Best-seller NestJS multi-tenant SaaS boilerplate — one API, per-tenant databases, billing, and Keycloak SSO.